
1) Power through Precision
At the end of the day we all want to go faster – but how do we know if we are getting fitter, stronger, faster? One of the first things you might do is to time whether you ride faster on a certain ride. Measuring speed isn’t a great indicator of your performance or fitness though, because speed is affected by so many things, such as the surface, the terrain, hills, wind speed and direction to name a few.

Power is much more precise!
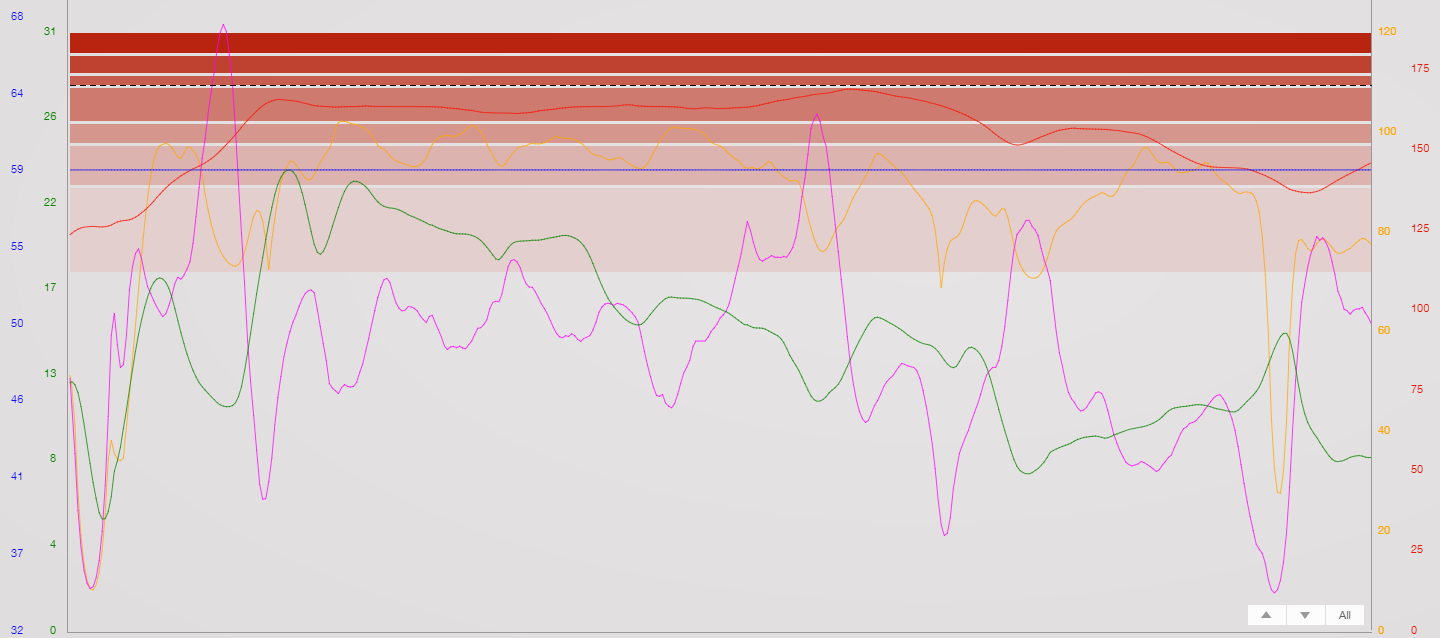
Heart Rate stays mostly in the same zone
Heart Rate is really useful in some ways as it is a simple and fairly accurate way to help gauge our effort level, or tell us which zone we are training in – but is far from perfect. Heart Rate Monitors measure your body’s response to effort – how much stress it is under, rather than how much power you are actually delivering. Your heart rate can vary according to all sorts of other variables, things such as fatigue, hydration and temperature. This means that you can’t be sure that you are putting in the same effort whenever your heart rate is at a given level, or in a particular zone. Secondly heart rate is relatively slow to respond to an effort meaning at times it is no more than a vague indicator of your effort. It lacks precision and it is precision that allows you to accurate measure the amount and quality of the training you do and to train specifically so that you can maximise your training and make real improvements to your performance.
This is where power meters are the only option – accurately measuring your increasing fitness levels and progress and eliminating the guesswork from your training, meaning you can use targeted training to gain more fitness less time.
2) No slacking!
Using a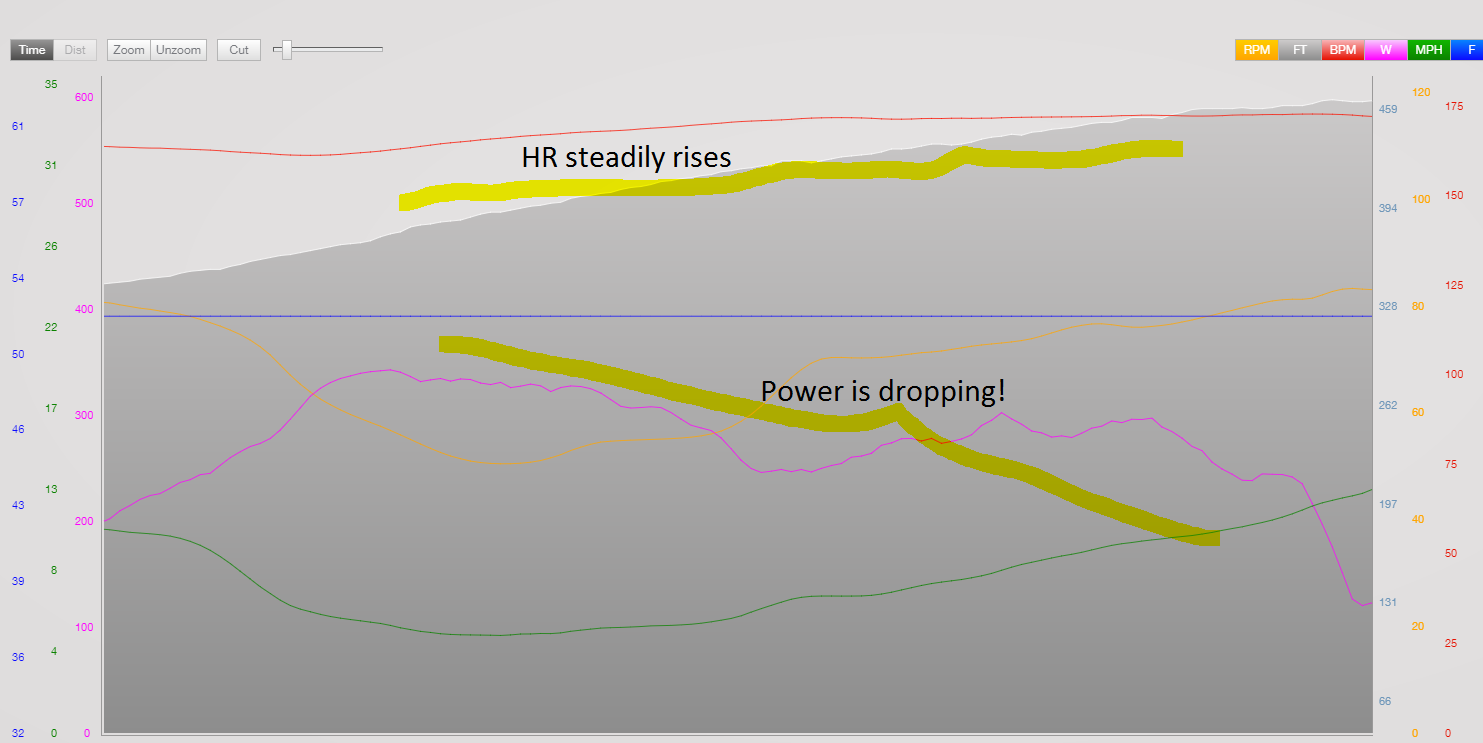 power meter means that you can get the best out of every single hill, every single interval, every single effort. In this example, see how Heart Rate suggests effort is increasing but in reality power output is dropping. This is due to the fact that the heart is slow to react to changes in training stress – your heart is still trying to catch up even when you have stopped pushing so hard. It’s easy to ease off if you see your heart rate is still rising – thinking you’re working hard enough. Focus on Power instead and you push just a little harder for a little longer to get the full training benefit of working in a certain zone. Do this every time you make an effort and you are doing far more quality work in a given training time. This all adds up to much better use of your training time, meaning you train much more efficiently, getting the results you want in less time!
3) Better than average.
Measuring the power you have produced is a far more accurate reflection of the work you have done in training than speed for instance. In much the same way, Normalised Power (NP) can be a more accurate reflection of the work you have done than Average Power (AP).
Riding at 20 mph average at a consistent speed on the flat is very different from averaging 20 mph on a lumpy or hilly course, where your speed will be both higher at times and lower at times – yet your average might still be 20 mph. It would be much harder to maintain a 20 mph average on a very hilly course, for instance.
Similarly your average power might be the same on two very different rides, even though one might be a steady, flat ride and the other a more difficult, hilly r ide, where you are trying much harder up the hills, but barely trying downhill. The hillier ride IS harder – ie the physiological ‘cost’ is more, the training stress on the body is more than a steady flat ride. There is simply no way of quantifying this with speed, but by measuring this variability in power and some clever mathematics, Normalised Power can be calculated which gives a more accurate reflection of the physiological ‘cost’ – a truer picture of the work you have done and the training stress to which you have subjected your body.
4 )  On the limit
Careful analysis of event and race power data in particular can highlight what is limiting your performance. What are your limiters? Is it producing very high power for short periods, meaning that you miss the breaks in a road race or crit? Is it more about sustaining a high percentage of your maximum power for longer periods, making you struggle in time trials? Is your finishing sprint weak?
Another useful tool is the Power Profile graph. This takes your best peak powers and compares it to recognised standard performances, making it easy to see how you compare to others in various kinds of efforts.
In the power Profile here, this rider is incredibly strong over 5 minute and 20 minute efforts – but really rather weak in the maximum power they can produce for very short periods. This immediately shows us that they need to work on their maximum power if they want to be competitive in a finishing sprint. In the mean time they could use their strengths to break away and TT alone to the finish. The data clearly shows that rather than leave it to a sprint that they would inevitably loose, it’s far better for this rider to attack – it’s easily their best chance of victory.
This is an example of how power meters can help us to identify what areas we really need to work on, and also inform our race tactics.
5 ) Predict Peak Form
The accuracy of power meters allows you to more closely monitor the amount of work you’ve done in training and the effort you’ve put into it. By recording the volume of training and taking into account the intensity we can calculate the total load or Training Stress on the body. By gradually increasing the load on your body you will train it to get stronger but conversely you will become more fatigued. An experienced coach can skilfully use the wealth of data from form your power meter alongside tools such as the Performance Management Chart to help decide when to increase your training and when to back off to allow your body to recover and grow stronger. Ultimately, by getting the balance of training and rest just right you will be able to predict when you’ll be in peak form – or even better, a smart coach will tailor your training to ensure that you come into peak form exactly in time to achieve your goals.

PMC Chart taken from Training Peaks
In the example PMC here, notice how ‘fitness’ – CTL (the blue line) is rising from the time training got under way towards the end of March to mid July. ATL or ‘fatigue’ (the pink line) is also generally high. So the rider is doing lots of training but is pretty tired from it.
Around mid July, the coach prescribed less training in order to peak. ‘Fitness’ (CTL – the blue line) consequently slightly drops, but the important thing is that ‘Fatigue’ (ATL – pink line) drastically reduces, the rider is therefore much fresher, meaning that the resultant ’Form’ (TSB – the yellow line) rises dramatically signalling a peak in performance.
Of course, it’s not only about the numbers, there are lots more details that a professional coach will pay attention to in order to make you fitter, stronger and faster and to tweak your form, but judicious use of the data that you can only get from a power meter takes a lot of the guesswork out of it!
6) Ideal cadence
The wealth of data produced by a power meter, when analysed using programmes such as Training Peaks or Golden Cheetah can give us great insights into our ideal cadence in different situations as well as which kinds of efforts and cadences are likely to improve our performances in various kinds of events and on various kinds of terrain.
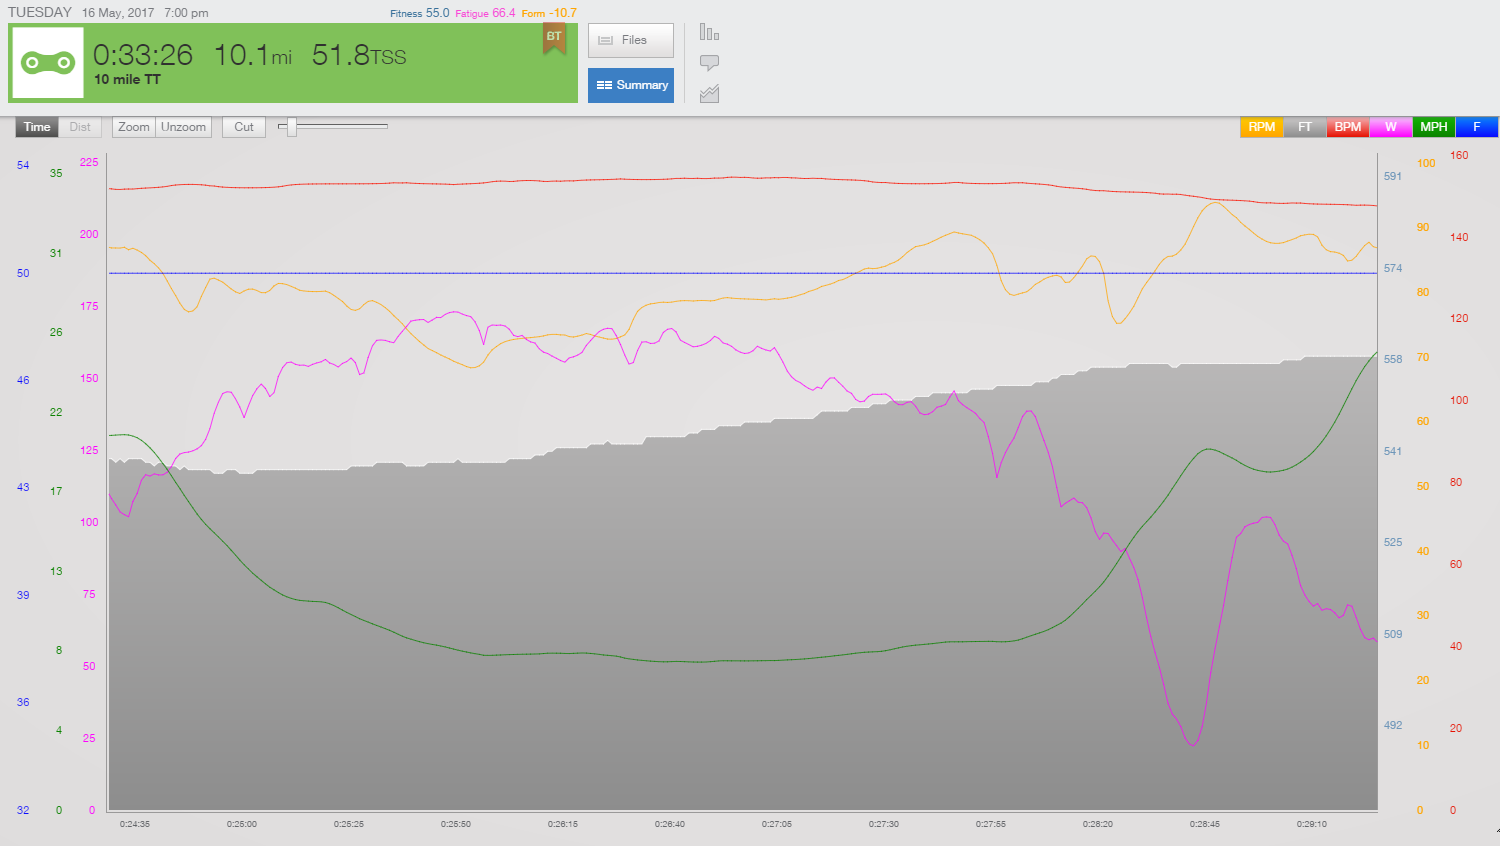
Time Trial analysis
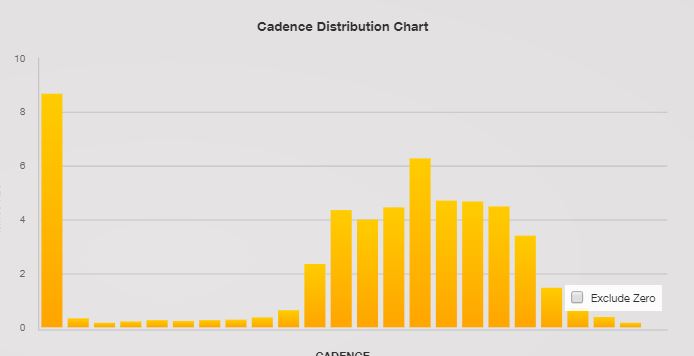
Cadence Distribution
We can investigate a riders ideal cadence in several ways. Looking at a simple cadence distribution chart, or pinpointing specific sections of rides where the power drops can give us valuable information. In the graph shown of a hilly Time Trial, we can see power dropping (pink line) as cadence rises (yellow line) when the road went up (dark grey is the profile). The rider changed into too easy a gear, keeping cadence high, but consequently loosing power. Simply focusing on pushing over the top of each rise without changing into too easy a gear helped that rider to PB in the very next race on that same course.
In simple terms power on a bike is a product of how hard you push (force) and how fast you pedal (cadence), but each kind of terrain and event has different characteristics. Often it is not only about how much power you produce, but equally about how you produce that power.
For instance an endurance event on the track will need high power outputs, but also high cadences, so the data from a successful rider would show high power being produced at high cadences. The actual forces aren’t necessarily very high because high cadence (‘how fast you pedal’) is a larger component of the overall power produced.
In other events, such as standing starts on the track, BMX starts, often on hill climbs, etc the force part (‘how hard you push’) is a larger component in producing the power. Here we might see much bigger forces being produced at lower cadences for that initial start or effort.
A more in depth tool for investigating the relationship between force and cadence is Quadrant Analysis. Using QA we can see riders’ preferred cadences under different conditions. It can also give us an insight into what cadences to work at more in order to improve their performances.
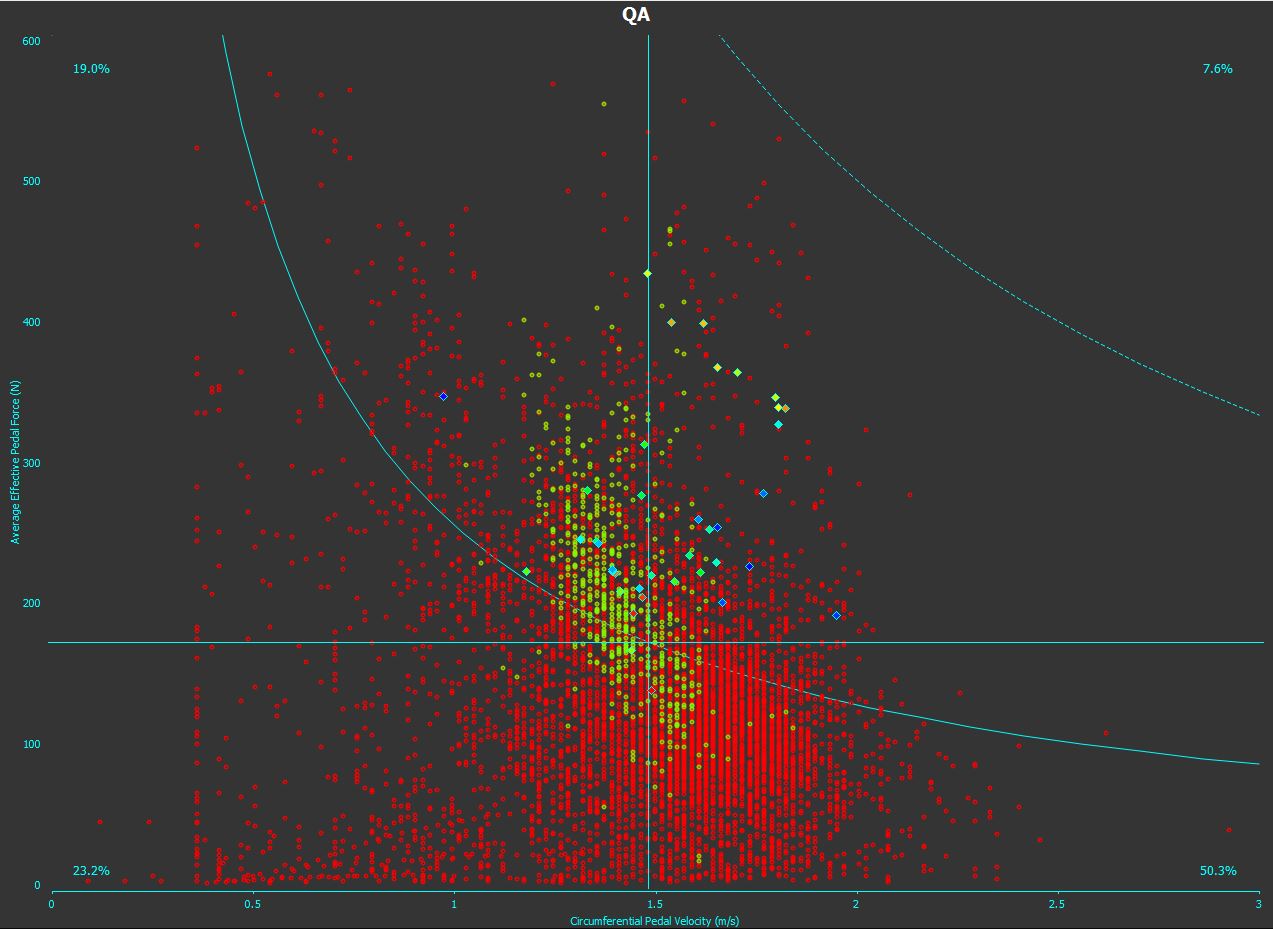
Quadrant Analysis of a mixed road ride
On the QA graph shown here, of a mixed road ride, you can see that 50% of the time was spent in the bottom right quadrant – this is relatively high cadence and relatively low force. So when ‘cruising along’ this rider uses a fairly high cadence. They spent only 19% of the time in the top left quadrant – lower cadence but high force production. However, one specific climb has been highlighted (the green dots). So you can see that when riding this long climb, the rider spent the majority of their time at lower cadences, whilst producing higher forces.
In this case the rider just rode as they liked, so we can deduce that they prefer to ride hills at lower cadences. By getting this rider to ride up the same hill in various gears we can find out the most efficient cadence for them. Perhaps they’d go better at higher cadences? Or perhaps they are naturally riding at their most efficient cadence, for hills of this kind of gradient. Using data that you can only get from a power meter we can easily investigate and advise them of their most efficient cadence for climbs of certain gradients and/or lengths.
Similarly we might use this data to inform their future training. For instance, if this rider were riding the road but training for track endurance events, we might suggest they aim to spend more time on their road rides in the top right quadrant – ie aim to keep the cadence high when they are pushing out the Watts – spend more time at higher cadences combined with higher forces. After each ride we can quickly check whether they have indeed done this – they might produce the same average speed and power on different rides, but by using QA we can check that they are making the most efficient use of their training time, with their specific goals in mind.
7) More or Less and When to Progress
Intervals are a way of making the most of your training time. By alternating periods of higher intensity work with less intense recovery periods you can fit more quality work into a given time period. There are countless different interval schedules, at various intensities, work or recovery periods and ratios, which all produce different training effects. As you get fitter you should aim to progress, whether that’s by increasing the number of intervals, increasing the work periods or decreasing the recovery times.
However, without a power meter it’s really difficult to know for sure whether a set of intervals was ‘good’ and when it’s time to progress. The picture here shows a set of intervals – The blue background is the prescribed session, actual Power delivered during the session is the pink line and actual Heart Rate is the red line.

Prescribed Intervals with Power and Heart Rate shown
Looking at the Heart Rate alone it appears that each interval was harder and harder as the peak of the red line rises throughout the session (Note also how HR takes a while to respond to the increased Power). However the reality is different – the actual Power was about right for the first 3 intervals, but the rider struggled with the last 2, not quite keeping up to the prescribed level (blue background).
If we only had Heart Rate we might think the session was perfect – indeed, in each successive interval the HR was higher and higher – so it would be easy to assume they managed easily and should progress to longer intervals. However this would lead to excess fatigue, without the benefit of the intervals (they weren’t completed, after all) and could eventually mean the rider is overtraining.
Only the accuracy of the Power Meter gives us the whole story – while the rider was undoubtedly trying very hard, the power was actually dropping. The data informs us that the rider is struggling to hold the power right to the end, which informs the next interval session. It’s too early to progress – another session or two at this level is needed before the rider can move on. When the rider can hold the desired power for the whole set then it’s definitely time to move on! Note though, that this session is just about right – ideally that last effort should be a struggle – then they are training as hard as they can! If the intervals are all completed without too much effort then they are set to low/short for the rider to get the most out of the session.
8) Pacing and Racing Strategies
Whether you’re riding Time Trials, Sportives, Road Races, Crits, Ultradistance cycling or anything else working with a Power Meter can guide your pacing and improve your racing strategies.
From simple average power and the intensity that you can achieve over rides of different lengths to calculating when and where to make your biggest efforts to make that break, the wealth of information a Power Meter provides is invaluable.
For example in a Time Trial smooth power delivery will be most efficient, so you will be aiming for low variability in power (measured by the VI – Variability Index) showing a consistent ride. The intensity that you can sustain clearly depends on time, so an Intensity Factor (IF) of 1.05-1.10 might be expected in a 10 mile Time Trial (ie 105-110% of your FTP) dropping to about 1.0 (100% of your FTP) for a 25 mile TT.
As the event gets longer, so your sustainable power drops, so in a Sportive of around 100km you might see an IF of 0.80-0.90 dropping to 0.70-0.75 for an all day Ultra and a little less for all multi-day Ultra rides.
Pacing becomes much easier armed with this type of information!
Delving deeper into the data can reveal more subtle pacing strategies such as the most efficient variability in power on rolling courses (ie. if and when to push harder up the hills and easier down them), at what speed to stop pedalling down a steeper hill, whether to ride negative splits and if so, how?
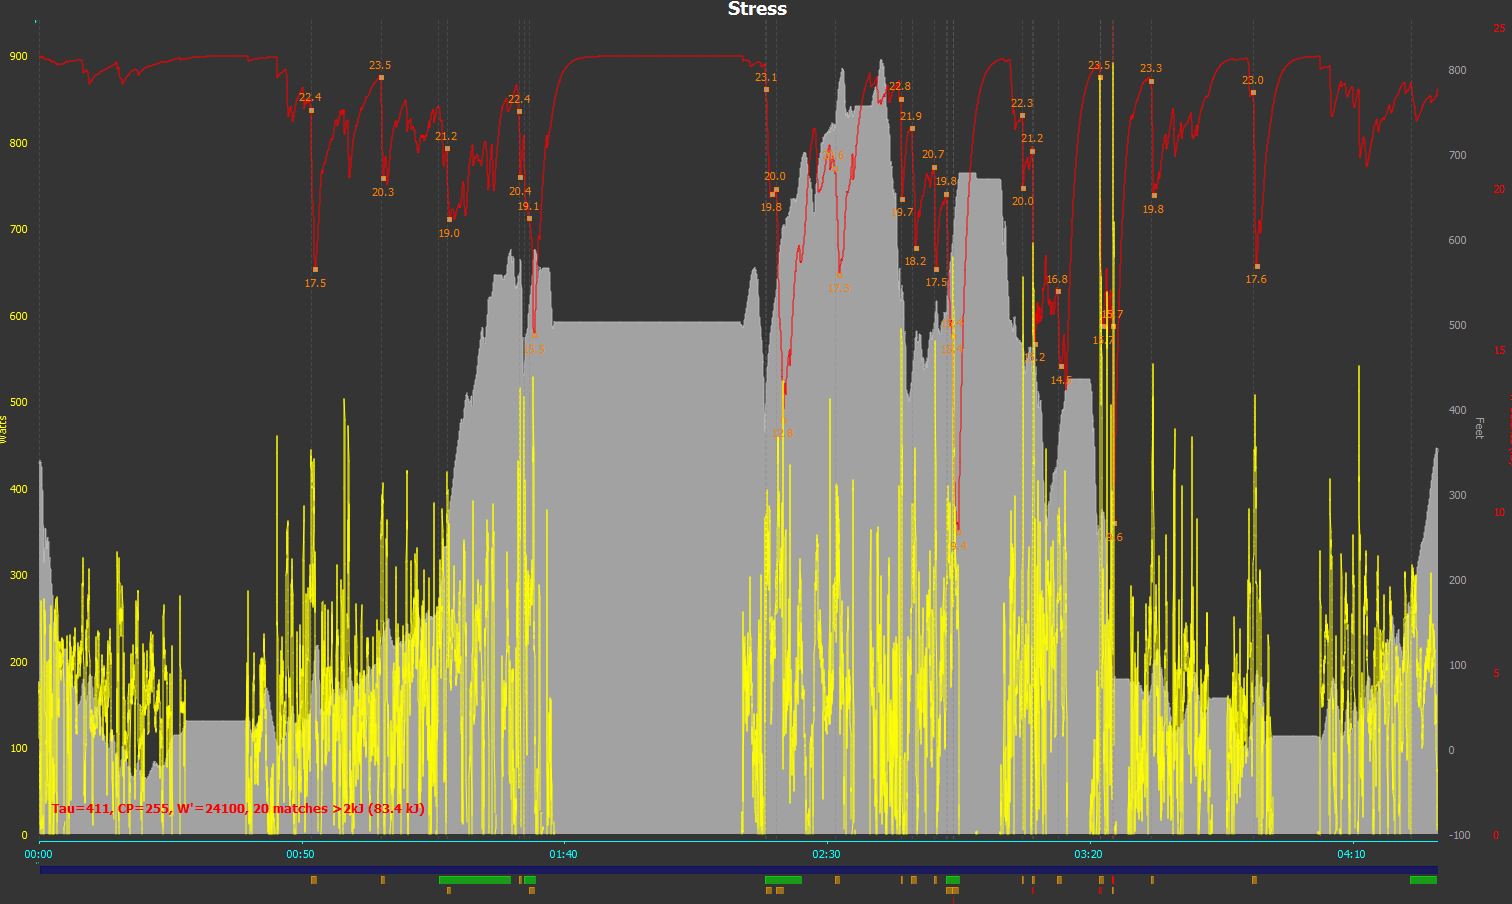
Stress Graph shows 20 matches burnt!
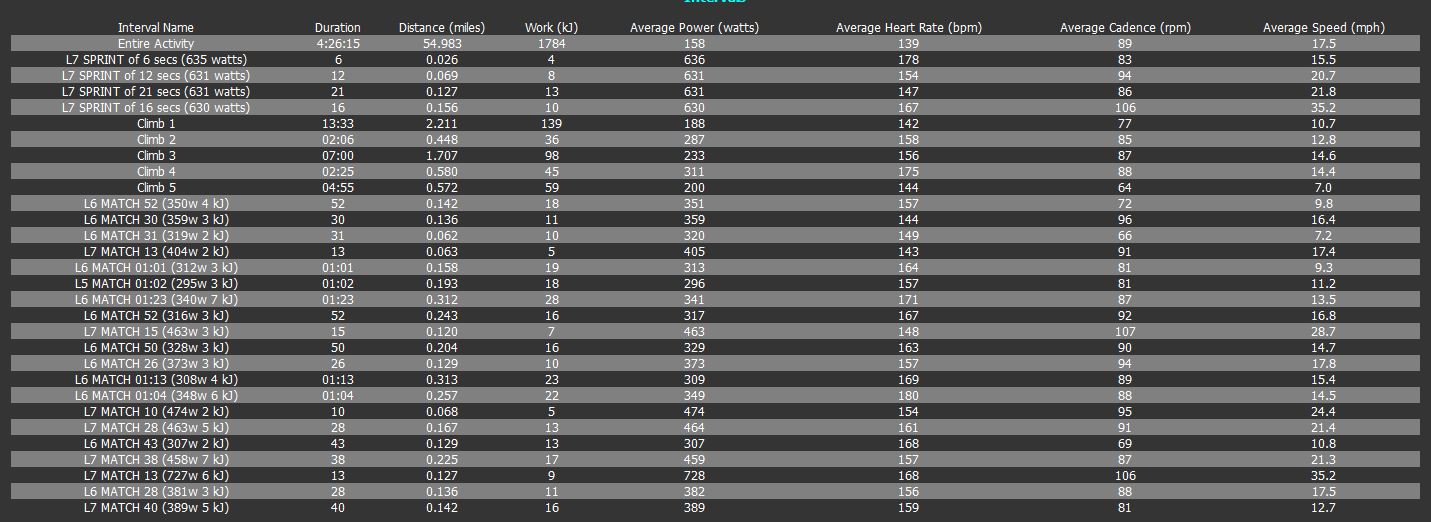
Corresponding intervals showing biggest efforts and matches burnt
Mass start races get even more complex as so often the pace is dictated by others. Here it is still all about measuring your effort, but in different ways. In much the same way as in Time Trials, a Power Meter can help you pace yourself up the climbs, or in solo or group breaks. However, in a Road Race for instance, much of the time is spent saving energy as much as possible for those race deciding moments such as attacks, hills, breaks and the finishing sprint. Every time you make a really big effort you ‘burn a match’. You only have so many ‘matches’ and when they are used up you can’t make those big efforts any more to respond to attacks etc. Your Power Meter can help you keep track of how many really big efforts you make, ensuring you have some ‘matches’ left to make the winning break or finish it off in the sprint.
Analysing your race data is both where it ends and at the same time the beginning. What power did you sustain throughout the race? How consistent was your effort? Where and what were your Peak Powers? Did you hold on up the climbs? Did you follow the attacks, make the break? Did you have anything left for the finish? This is where a Power Meter really comes into it’s own – analysing your previous races – what contributed to your successes and what areas do you need to work on in order to succeed next time? There’s no need for guesswork – it’s all there in black and white….if you know where to look for it! If you enjoy spending hours poring over the data why not do it yourself, but if you simply don’t have the time, or inclination, why not get your coach to do it for you?
#PowerTrial Maximise your Training!
Call or email now for more details on 01803 316 785 / Info@BayCycles.co.uk
I hope you enjoyed this article – look out for more soon.


