Going for Gold in your next sportive?
Aim ing for a PB next year?
Racing Road, CX, TT, Duathlon or Triathlon?
or just want to get fitter, faster, lighter?
Whatever your goal KOM Coaching have just a few personalised coaching places left….

Going for Gold in your next sportive?
Aiming for a PB next year?
Racing Road, CX, TT, Duathlon or Triathlon?
or just want to get fitter, faster, lighter?
Whatever your goal KOM Coaching have just a few personalised coaching places left….
Training Peaks is the worlds leading training and coaching software.
Whether you use it as a simple training diary or for in depth analysis of your workouts, heart rate or power files, Training Peaks gives you the power to make the most of your valuable training time.
All KOM Coaching personalised coaching plans come with a free Training Peaks account.
After working with Training Peaks for some time I have now achieved Level 2 certification – their top accreditation.
Together with my British Cycling Level 3 coaching qualification you can be sure I have the knowledge to help you reach your goals.
Is Faster Fitter?
At the end of the day we all want to go faster – but how do we know if we are getting fitter, stronger, faster? The first thing we might look at is our speed. If we cover distance A-B in a shorter time our average speed is higher, so we’re going faster, right? Well, yes, we are travelling faster, but the speed we travel is affected by many things – the surface, the terrain, hills, wind speed and direction to name a few, so our average speed in itself doesn’t tell us if we are getting fitter, stronger and ultimately faster. It is hugely dependant on the terrain and at the whim of the conditions. This makes it really hard to tell how well we are going based purely on speed and makes it difficult to know for sure if our training is working and we are truly improving.
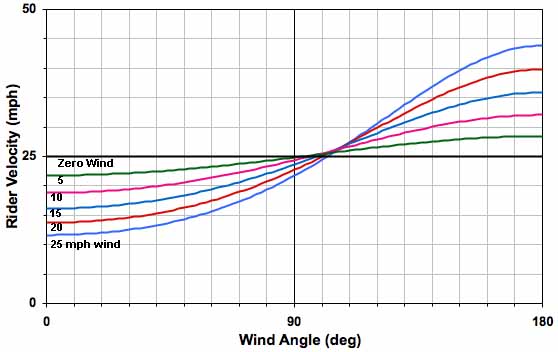
How wind can affect cycling speed
In the Zone
Intensity levels or training zones are one of the best training tools out there – in a nutshell working at a given intensity, or zone will bring about specific physiological adaptations. For instance working more in zone 2 will improve our basic endurance and cardiovascular fitness. So to train smarter we decide which areas we need to improve, then train more in the relevant zones(s) to target these improvements.
This another big reason why having an accurate measure of how fast we can ultimately go and how hard we are going in relation to that is so important. Accurate measurement helps us to set these training zones and then ensure that we spend a good proportion of our valuable training time working within the zones that will most benefit us.
We need an accurate way to gauge our effort level and how ‘fast’ we are really able to go.
At the Heart of the Matter
Many people train with a heart rate monitor. This is a simple and fairly accurate way to help gauge our effort level, or tell us which zone we are training in, but is far from perfect. Heart Rate Monitors measure your body’s response to effort – how much stress it is under, rather than how much power you are actually delivering. There are a couple of significant problems with this. Firstly lots of things put stress on the body and thus affect heart rate, things such as fatigue, hydration and temperature. This means that you can’t be sure that you are putting in the same effort whenever your heart rate is at a given level, or in a particular zone. Your heart rate might be higher because it’s hotter, you’re less well hydrated, or for any of a number of reasons. Secondly heart rate is relatively slow to respond to an effort, meaning that you can be working in zone 5 for instance, but heart rate takes a while to catch up and doesn’t reflect this effort. There is a time lag associated with heart rate that means it may appear that you have spent less time in a certain zone. For short, intense efforts, your Heart Rate Monitor might not register time spent in higher zones at all!

The Power Meter never lies
Power is a direct measurement of your output – it gives an objective measure of your performance. Irrespective of the wind, the weather, the surface, the terrain, which bike you are riding, how tired or dehydrated you are, it measures precisely how hard you are pushing and how fast you are pedalling to give your power output in Watts. Just for clarity, Power is the rate at which work is done, or Power = Work / Time. In other words the power meter tells you exactly how well (or badly) you are going.
Heart rate response is relatively stable – power measurements show a different picture!
Its not all about the zones
As well as this accuracy another really important advantage of a power meter is precision. Take the example of a very intense effort. Your heart rate will be within a few beats per minute whenever you make really intense efforts. Factor in the time lag associated with heart rate too and we soon see that information from heart rate alone doesn’t tell us much at all when near maximum. Take a typical rider with an FTP of 300 Watts (for simplicity, their ‘threshold’). Spending a relatively short period above this will make the heart rate rocket to near max (perhaps 185-190 bpm for example). So that could be 350 watts for instance. An all out sprint would also bring the heart rate up to near max (185-190bpm for this same rider), but the rider is now producing perhaps 3 or 4 times the power (for a much shorter period!), perhaps 1,000 or 1,2000 Watts. A power meter will tell you exactly how much. Remember too, that if this intense effort is really short, the heart rate might not even have time to rise up to near maximum levels at all.
There are times when being in a zone simply isn’t accurate enough…..
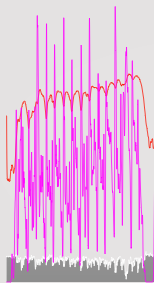
Data from a Crit – repeated accelerations shown by the fluctuating wattages (pink line) – but how hard do you need to accelerate to stay with the bunch in this crit?
So why now?
Setting and sticking accurately to zones and accurate and precise measurement are all well and good, but having all this data is next to useless if you don’t know how to use it. Libraries full of books and countless academic papers have been written on the subject but one simple and blindingly obvious area is often skirted over. The emphasis always seems to be on the benefits of training in a certain zone, spend more time in ‘Sweetspot’, more LSD (long slow distance training), less LSD but more HIIT (High intensity Interval Training), periodisation vs reverse periodisation, and so on, but very little is written on the importance of collecting data from your races (If you can get access to others race data too all the better!). It’s all well and good knowing how to improve your performance and get fitter, but knowing precisely how many Watts you are producing or need to produce can be the difference staying in contention or getting dropped, or the difference between winning and losing.
Example 1
In the graph ‘Data from a Crit’ (see above) we can see repeated accelerations (shown by the pink line). Using real, accurate power data from a race gives us an idea of just how hard we will have to sprint out of the corner each time – and how often we will need to repeat this. There is a world of difference between producing 600 watts once every 5 minutes, and 1,000 watts every minute! Analysing race data will tell us what we need to do in order to compete and therefore shape our training if we want to be successful in this kind of events. There simply is no o way, other than using a power meter, to accurately monitor your training, progress and ultimately your race performance.
Example 2
These next graphs show a hill (see the slope in grey). The first graph only shows heart rate. All we can say is that heart rate steadily increases as the hill is climbed. However the second graph tells the real story. Looking at the power curve (pink line) shows a fairly steady start to the climb, followed by 3 increasingly sharp accelerations just before the finish. In this case the fist and second accelerations softened up the rivals and the third one finally created a small gap – just enough to get to the top first. The difference between winning and losing. 647 Watts wasn’t enough, 804 Watts wasn’t enough – in this case we can see that 923 Watts did it!
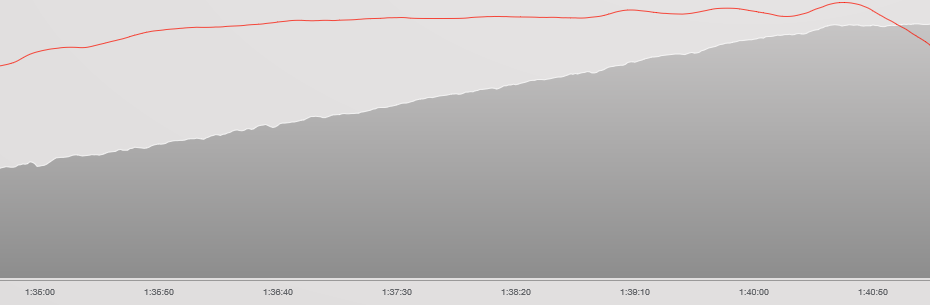 Graph 1 – Final climb, heart rate only
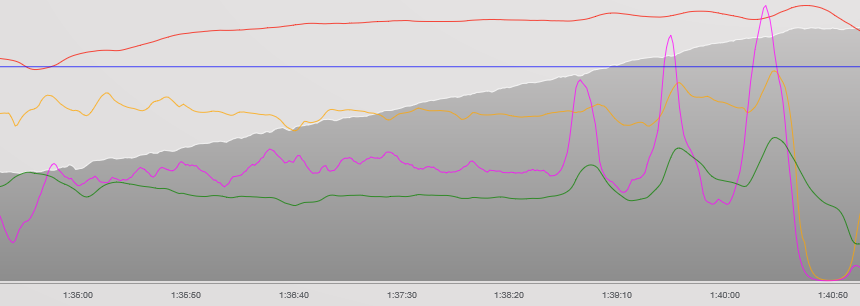
Graph 2 – Final climb , the power to succeed!
The POWER of NOW!
We’re right in the heart of the race season – go out there and collect that vital data. Find out exactly where you are NOW while you’re pretty much at peak fitness. Analyse what strengths and weaknesses you have and what you need to do to succeed. The information you will gain from your power meter now is invaluable. Analyse that data well and it will guide you so you know exactly what and how to train and ultimately show you how to be fitter, stronger and faster in the future.
Why not hire a Power Meter? Take your performances to the next level by training smarter with the unrivalled accuracy and precision of a power meter.
The biggest bike race in the world has started.
Have you ever wondered what it takes to ride and compete at this level?
Training Peaks provide data files throughout the three week race for some of the riders, so you can see their magic numbers!
They also analyse the ride a little to give you an insight into just what it takes to ride Le Tour!
KOM coaching has provided official training plans for the Dartmoor Classic Sportive this year.
Event specific training plans are a great introduction to coaching.
“Just a note to say thanks for the training plans. I have been following them and have enjoyed the various plans. It has made training so much more interesting and I am not so tired”. Derek Symington
Good luck to all in the Dartmoor Cassic!
