On Monday nights Bay Cycles have started indoor cycling with the Stages Power bikes at Venning Ride. It’s a great way to keep fit through the winter evenings, with the motivation of the pumping music, sufferfest videos and friends to keep you company. I’m sure you’ve all been impressed with the state of the art Stages indoor cycling bikes, but if you’re new to it all the wealth of data can be very confusing. So what exactly are you getting out of it?
Here we will take a bit of a look at Lisa’s data to start to understand the benefits of training with power and how to use it to get you fitter, faster!
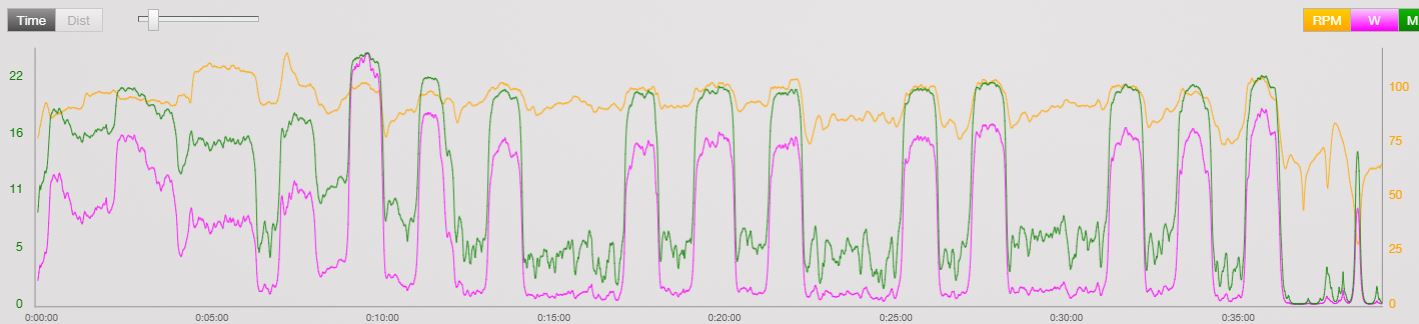
Graph
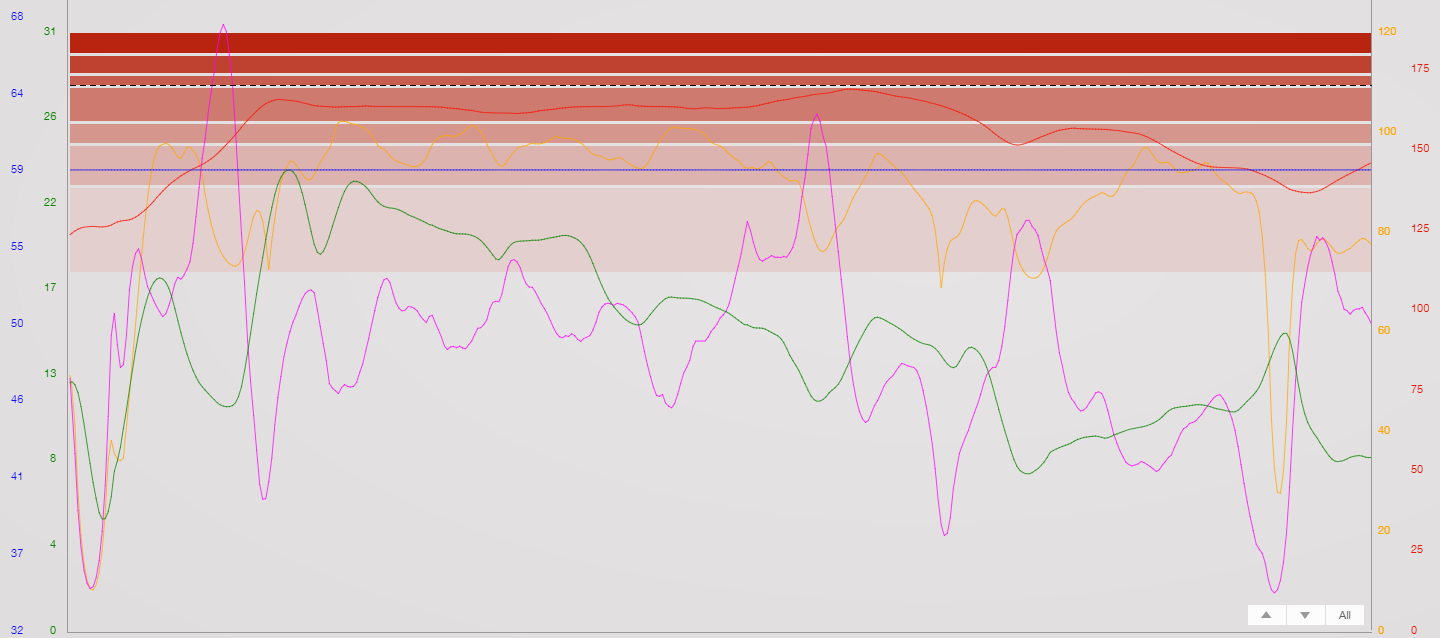
Looking at Lisa’s graph, the pink line is Power (Watts), the yellow line is cadence (RPM) and the green line ‘speed’ (mph). All we can see is how power, cadence and speed go up and down several times throughout the session. It has recorded the numbers for power, but I’ve deleted those numbers because, as Einstein said, its all relative! Everyone is different – some people are stronger than others, some are more well trained than others – so in terms of the effort you make in any one session, the actual numbers are not so important. What is important is how hard it was FOR YOU. This is one of the reasons we use ZONES.
Zones
Zones show this relative intensity. This way we can ‘measure’ how much effort someone puts in to a ride or workout regardless of who they are, whether they are beginners, experienced or even professional riders.
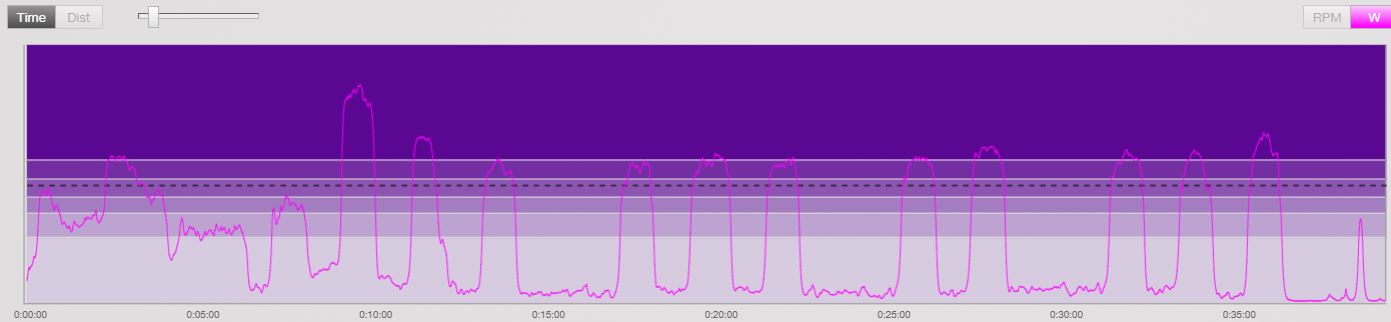
Zones also give us an indication of how the ride is helping us to get faster or stronger. Our body works in different ways in different zones, so we get different benefits from training in different zones. So this graph shows just the power curve, with zones in the background.
Threshold
In this graph you can see Lisa’s zones. The zones are in the background, from zone 1 at the bottom, to zone 6 at the top. ‘Threshold’ is shown by the dotted line. Threshold is known by different names such as FTP (Functional Threshold power), Lactacte Threshold (LT) and so on and each has different definitions. The basic idea is that threshold is the amount of effort that you can only just sustain indefinitely (or for a very long time, depending on the definition). In general terms, as you try harder and harder, your legs start to burn and it gets harder to sustain your power. Threshold is the point where it may be tough, but you can keep pushing at that level for a ‘long time’ (how ‘long’ varies according to the definition). Any harder and you simply can’t sustain it. You might be able to ride harder than that for a short while – it will feel harder and harder, legs burn more and more – but after a few seconds, a few minutes or several minutes at most you simply can’t sustain that level of effort – you ‘blow up’.
Sufferfest
Now we have a real idea of how hard that session was – look at all the times Lisa made really big efforts, above her threshold. This was a sufferfest video session and it does what it says on the tin – it makes you suffer! So in this session which lasted just under 40 minutes. Lisa made 12 really big efforts above threshold (including one in the warm up). Each time you go over your threshold it hurts – so yes – Lisa did suffer!
We can look at this slightly differently and see how much time Lisa spent in each of these zones;
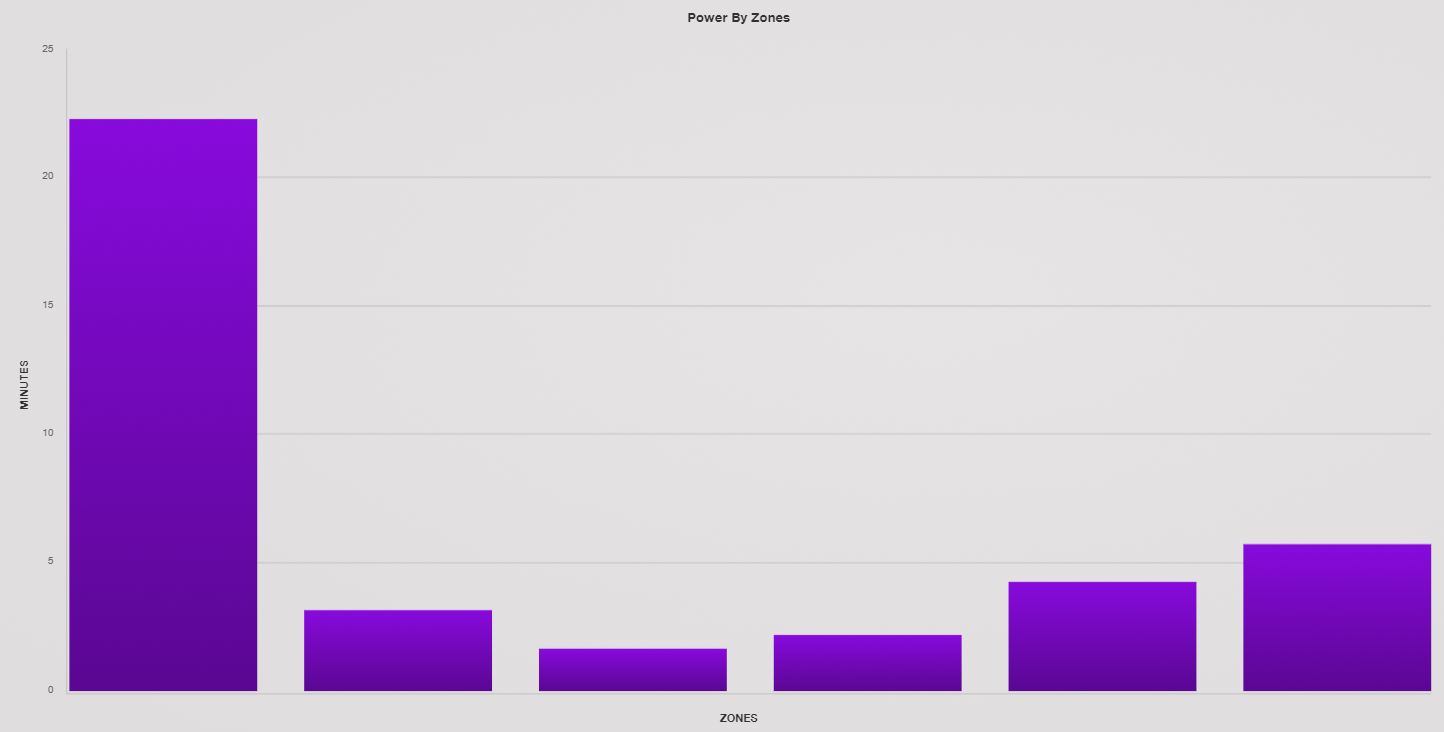 This graph shows the time spent in each zone. Zone 4 is ‘threshold’, and Lisa spent a good couple of minutes there. However, lots of the session was really hard, above threshold in zone 5 (over 4 minutes) and extremely hard in zone 6 (approx 6 minutes). So this was a high intensity session. Repeatedly going over threshold (12 times in 40 minutes), spending a few minutes in zone 5 (often called the VO2 Max zone – as it helps to improve your aerobic capacity) and several minutes in zone 6 which develops anaerobic capacity, lactate tolerance and starts to work on neuromuscular power too.
Intervals
Incidentally, interval sessions like this, where you repeatedly ride really hard then easier to allow some recovery mean that you can spend more time riding very hard than if you just ride fairly hard all the time. That’s why people use interval sessions to train – you can work harder in the same amount of time.
Intensity
Looking back at those graphs we can see that power was often low and often high or very high – but overall how taxing was it? Well there is another measure we use call Intensity Factor (IF). This measures how hard the workout is for YOU relative to your personal threshold. An IF of 1.00 is equivalent to 100% of your threshold – so it is theoretically the maximum effort you can possibly make (in an hour in this definition).
Despite the many easier sections, overall the IF for this session was 0.90 or 90% of Lisa’s threshold – which is pretty good going! This is just another way of showing how very hard this session was – and another way to compare this session with any other. With that in mind, lets see how hard Lisa tries and how much she suffers next week!